Saturday, 16 November 2013

Technology focus - ECU Development - Measurement and Calibration


The ECU (Electronic Control Unit) used in development process is not the same as a production ECU. It is specially equipped with a suitable interface for calibration which you will never see on a production ECU!

There are a couple of technologies available to 'talk' to the ECU, one is a simple CAN based interface - with a calibration interface driver software installed (known as CCP - CAN Calibration Protocol) – in this case, the ECU needs extra memory (compared to standard) to facilitate the on line handling of the measurement labels. Another option is to equip the ECU with an 'emulator'. This device is installed inside the ECU and has direct read-write access to the data bus inside the micro controller. It also has additional memory and processing capability in order to directly handle communication with the PC running the calibration tool software. Generally speaking, the emulator has superior performance to the CAN solution, but is more complex and costly to implement.


Fig 1 – ECU emulators (also known as ETK) can be parallel (i.e. directly connected to the data bus) or serial (i.e. directly connected to the microcontroller) (source: ETAS)

Once you have the physical connection to the ECU, then you need to understand what is going on inside, and be able to make some sense of it - also, you need to be able to make changes to parameters and store, or apply them. To facilitate this, you need 2 pieces of information, the actual calibration of the ECU, which is stored in a HEX file and information about how to read the HEX file, this is the A2L file. 

The HEX file is a binary file, so you need some additional information (from the A2L file) to know which part of the memory inside the microcontroller, is used for what values, and how do we convert the 1s and 0s into something meaningful – a physical value – for example, engine speed. These A2L and HEX files are standardised, and are delivered with every development ECU to allow the Calibration Engineer to access and calibrate the ECU.

Fig 2 – Once you have access to the ECU, you need to understand what’s going on inside – the a2l and hex file provide this! (source: ETAS)

The task, measuring and calibrating
So now we know the hardware and software involved, what does the calibration task actually mean, and how is it done? With the above mentioned set up, we can access the ECU during run-time, and make changes, for example, changing ignition timing to give the best performance at any given engine operating condition (speed, load). The ignition timing is held in a ‘map’ – the map covers all engine operating conditions and provides an ignition timing demand value as a set point. Using the calibration tool, the map can be adjusted during testing, optimising to give the best performance. Note that a map is considered as a single value (or label) to be calibrated.

Fig 3 – Calibration is round trip Engineering, making adjustments, measuring, analysing and then adjusting again (source: ETAS)

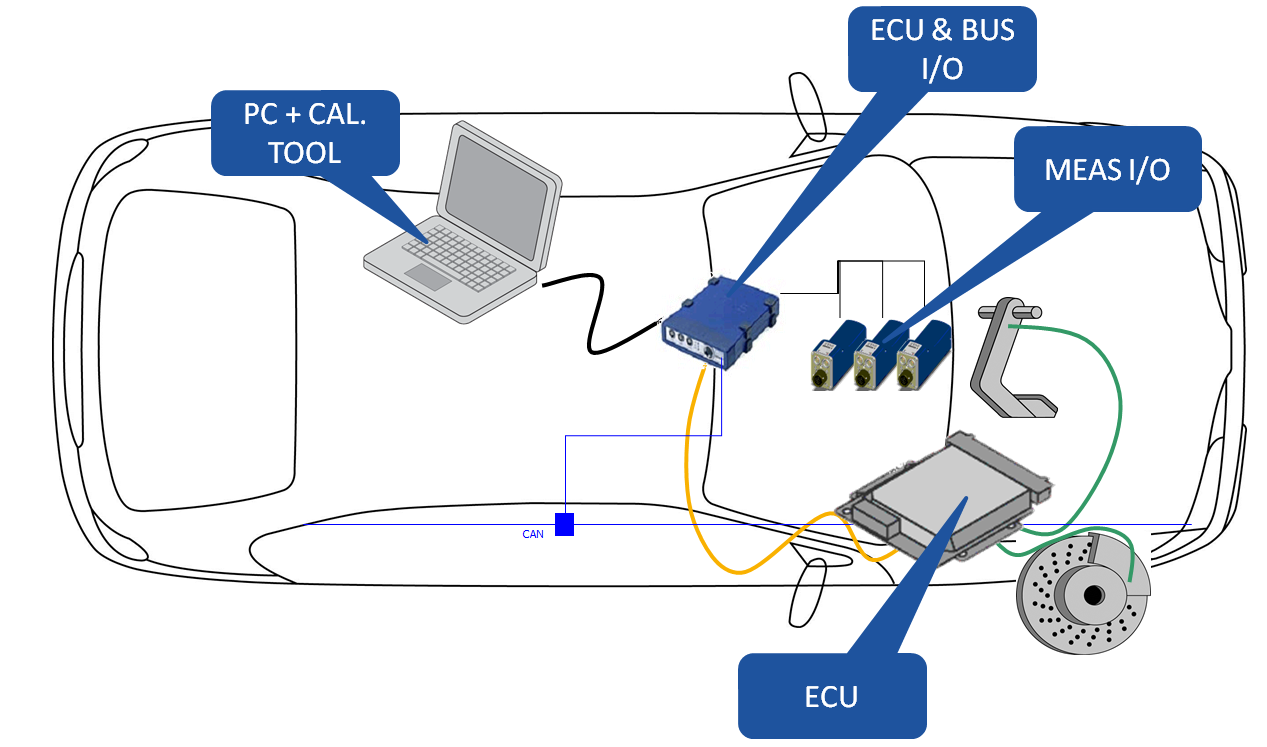
The calibration Engineer, using the calibration tool, has access to all the labels during testing, so he can adjust the calibration labels, and see responses by monitoring the measurement labels. In addition, the engineer may want to measure some additional information. So it is often the case that the calibration tool is used in conjunction with some measurement hardware, so that physical values can be measured with additional sensors, for example – exhaust temperature may be measured using installed sensors on a development vehicle, in order to calibrate the exhaust temperature model inside the ECU, which is used on the production ECU for component protection.

Fig 4 – Screenshot of the calibration tool, showing maps and curves (calibration labels) that need to be adjusted and optimised (source: ATI)


Fig 5 – Overview of a typical vehicle measurement set-up for calibrating the ECU (Source: ETAS)


During the development cycle, the Calibration Engineer will adjust and change many values inside the ECU in order to optimise and characterise the engine. In a modern powertrain, this can take teams of people months, or even years to complete. Consider an ECU, with 30,000 labels, which will be fitted to 10 variants of vehicles. Each vehicle has a different calibration in order to differentiate it in the market. Each vehicle has to be calibrated with respect to emissions, performance, fuel consumption, drivability and on-board diagnostics – each one of these tasks is considerable, and they all impact on each other. It is very typical that calibration of a single ECU variant is managed by large teams of Engineers, often with specialist knowledge of how a function works, and how to calibrate it. For example, there may be a team of Engineers calibrating emissions, which will include a specialist person or team who can deal with the start/stop system, or the after-treatment system. This complex environment creates masses of data (calibration and measurement) that needs to be handled, analysed, controlled and merged, in order to create the final ‘master’ calibration that will be signed off by the Chief Calibration Engineer. This is the final version that will then be deployed on the production vehicle. This final calibration is normally ‘flashed’ into the ECU during the vehicle production cycle. Prior to the final vehicle test, in the factory before shipping of the vehicle.

The future for ECU development
It recognised in Industry that the calibration task and associated software development for controllers is becoming the majority task in the development of a modern vehicle or powertrain. This trend is unlikely to reverse is becoming impossible to manage efficiently with traditional technical approaches. To deal with this, new methods for the task are being developed, optimised and deployed. A popular approach is model-based engineering. This means reducing the amount of testing, by making some strategic measurements, then using a mathematical model to fit to the measurements, and provide accurate prediction in the areas where no measurement was made. For example, if we take a simple map, which is 8 by 8 is size, this means 8 x 8 data point = 64. So, in order to populate this map we would need 64 measurements! However, it may be possible to make 20 strategic measurements, then fit model to this data, then make 12 measurements to validate the model (=32) and this would reduce the number of measurements by half. The key here is to define the measurement strategy effectively to be able to fit a model accurately. This needs an approach called design-of-experiment (DOE).

Fig 6 – The more parameters to be adjusted, the more work to be done, with current systems, the complexity is such that with a traditional approach, it would take years to calibrate an ECU!

Another fast moving trend to accelerate the development of ECU is the concept of ‘frontloading’ – this means, moving specific aspects or tasks earlier in the cycle, where they can be performed in a lower cost environment. For example, if a vehicle manufacturer did all their development with prototype vehicles, then the cost would be massive as many, many vehicles would be needed. So, to save time and money, if some of the tasks can be done in a test facility, then this is generally cheaper because the facility can be adapted and re-used again and again. A good example here is the engine, or transmission, a large amount of development can be done on a test bed, with just final adjustments and refinements made in a vehicle test.

With current technology developments, this has moved forward a step - much development work can now be done on a PC, with a simulation environment – and this very applicable to ECU development work. ECU software and functions can be developed and tested easily in virtual environments. A full ECU, with a vehicle, driver and environment can be simulated on a PC, and the simulation can be run faster than real-time, this means a 20 minute test run can be reduced to a few seconds (depending on the complexity and PC processing power) – providing simulated results for analysis and development. A typical next step would be to have the ECU itself in a test environment – thus being able to test the actual ECU code, running on the ECU hardware, with physical connections to electrical stimulation, but a complete virtual test environment (driver, vehicle, environment). This approach is known as HiL testing – Hardware-in-the-Loop!


Fig 7 – Signal flows in a real systems, compared to HiL simulation (source:dSPACE)

Fig 8 - Typical development paths and tasks for ECU development (Source: ETAS)

There is no doubt that developing and calibrating an ECU is a complex task! Many tools and technologies are available to help, and many more will need to be developed to keep up with the demand for more sophistication!

Tuesday, 29 October 2013

Technology focus - Engine Downsizing and Downspeeding


You may have heard the term – Engine Downsizing. It’s a hot topic in the automotive world and many car manufacturers are hurriedly developing ‘downsized’ engines to meet current and future emission regulations. Some, like VW are already ahead of the game and have these engines in production to buy today. But what does this concept actually mean? What are the benefits to this approach? And what are the technical challenges? 


Improved fuel economy and reduced CO2 emissions are the major challenge faced by vehicle manufacturers developing future passenger car powertrains. Gasoline engine downsizing is the process whereby the speed / load operating point is moved to a more efficient operating region (at higher load) through the reduction of engine capacity, whilst maintaining the full load performance via pressure charging. Downsizing concepts based on turbocharged, direct injection engines are a very cost effective solution. The most significant technical challenges for such fuel efficient turbocharged GDI (Gasoline Direct Injection) are providing the required low end torque and in addition,  a suitable transient response to give the required levels of engine flexibility and drivability.


Fig 1 - What is downsizing?

In downsized engines, by applying a refined single stage charging concept, the full engine torque can be available as low as 1250 rpm. This can be combined with a specific power of 80kW/l. With the use of dual stage boosting, High torque, with a specific power > 140 kW/l is achievable. In conjunction with some other new technologies - exhaust cooling, cooled external EGR at high load - this results in a significant improvement of the real world fuel economy. In addition, efficient spray guided, stratified charge systems are utilised to gain further improvements. The overall goal is to create an engine with excellent high load performance and durability, and to operate the engine in this high-load region as much of the time as possible. The combination of GDI and turbo charging, implemented on a small displacement engine, is the good basis to combine high real world fuel economy with an acceptable performance - even under a stringent CO2-scenario.


Fig 2 - Downsized engine - torque/speed/fuel consumption - development over time

Why Downsize?
In the past gasoline engines were perceived as a very cost effective Powertrain solution. Emissions were not that important as long as three way catalyst technology was used to ‘mop up’ the exhaust. Fuel economy was not really the primary target. If you wanted good fuel economy, you’d buy a diesel! But, on the other hand, diesel engines needed considerable technological effort in order to meet emission legislation, and diesel engine developers were allowed to introduce rather costly technologies in order to meet these emission targets.  The key word was: “emission is a must; low fuel consumption is nice to have”. In current times, there’s a new direction, and that is CO2 reduction.  This discussion is significantly enhanced by a penalty tax for OEMs (Original Equipment Manufacturers) not meeting future CO2 limits. Now as CO2 is seen as a harmful emission, gasoline engine developers get a chance to invest in some fuel economy technology. With Gasoline engines in particular, downsizing/downspeeding concepts based on turbocharged GDI, seem to be in pole position for the race of the most accepted technology for reducing fuel consumption - whilst keeping the additional benefit of performance and drivability (when compared to a traditional diesel).


Fig 3 - The technical challenges to achieving a downsized engine concept can be considerable

Technology and Challenges of Downsizing
So what are the technical aspects of a downsized engine?  It’s a small engine that produces high power. So, it’s operating much closer to the thermal and physical limits of the materials used in construction of the major engine components. It needs to have the following attributes:
  • A well designed combustion system that allows high compression ratios to promote efficiency
  • It needs to have excellent low speed torque, as most of the engine power is produced via the torque – like a diesel engine
  • It needs to have good, transient response to give an appealing performance to fulfil driver expectations
  • Good fuel economy – reduced requirements for full load enrichment
  • Very robust and durable base engine design
In order to achieve the above engine profile, there are a number of technologies in development and use. They can be used in combination with each other, or in conjunction with other technologies for CO2 reduction (like mild-hybridisation and start/stop) - some of the technologies specifically involved in a 'downsized' engine package are:

  • Direct Gasoline Injection
  • Turbo and super charging
  • Cooled EGR
  • Active Exhaust cooling
  • Variable valve timing


Fig 4 - Cooled turbocharger housing - no need to run rich to control high exhaust temperatures, thus saving fuel (Source: AVL)


Downspeeding
This is another similar approach, often mentioned in the same context as downsizing. It involves moving the most frequently used engine operating point, to where it is more efficient (as downsizing does, but in this case, lower speed instead of higher load). At lower engine speed, a higher torque is needed to maintain the required power. The advantage of low speed operation is that friction losses are reduced (due to lower rubbing speeds between components). In addition, this concept provides real fuel savings as fuel consumption efficiency often increases with lower engine speed. The technical challenge is that high torque means high load on all engine components, this increases material costs to cope with these loads. Also, Down speed engines need to have a fast torque build up, in order to meet the requirements for transient response. This requires as a minimum pressure charging, and in addition, perhaps some other technical approach to be able to produce the required torque – for example, electrical assisted Powertrain, or electrical assist for the turbo/supercharger.

De-rating
Another less common but viable alternative to downsizing is de-rating, especially for diesel engines. De-rating means to limit the power output of a given engine design - that is, not going to the specific power extremes of the design (power density typically limited at ~ 45 kW/L). The advantage here is that this lessens the requirement for a sophisticated engine design with expensive high-end components, due to lower PFP (peak firing pressure). Of course, for such de-rating concepts, viability has to be investigated with respect to the expected production volume, costs, image, regional market aspects, etc. - these factors all have to be taken into consideration.


Fig 5 - Comparison of concepts downsizing vs. de-rating (Source: AVL)

De-rating also offers the potential of commonality between Gasoline & Diesel engine family production. With increased number of common parts with gasoline engines, this leads to increased production volumes and consequently lower cost.

Summary
It’s a fact that downsizing is the current way forward; you can see in the market that most manufacturers have, or are currently developing, engines with lower displacements and better CO2 figures - maintaining the same power density. That’s all fine – if we can squeeze more out of an engine, increase its efficiency whilst maintaining durability, then that’s a win-win all round.
Developments in material technology and engine design have facilitated this opportunity, but future powertrains will need more than just smaller displacements to achieve forthcoming emission regulations, without sacrificing the driving experience.

So, downsizing and down speeding will be adopted in conjunction with other technologies. The reason is the smaller engines produce less torque, even highly boosted smaller engines, and the market will not accept ‘sluggish’ vehicles in today’s modern traffic. As we move towards micro and mild hybrids, and start/stop technology, the electric motor, as a torque supporting element becomes even more viable! An electric motor can produces full torque at low speed, and for short time torque boosting, is an ideal option to fill the gap in future downsized powertrains.


Tuesday, 22 October 2013

Engine Combustion - Spark Ignition (Gasoline)


Engine combustion is a fascinating topic to gain an understanding of, particularly when comparing compression and spark ignition, the fuels used and their properties needed for each respective type. Looking at details, and the current trends in technology. It’s not hard to see the convergence and similarity between gasoline and diesel engine fuel systems and combustion. Let's look in detail first at spark ignition based combustion

Spark ignition
For spark ignition combustion, the mixture is prepared completely prior to combustion (outside of the combustion chamber) - that is, the fuel is introduced to the air - fully atomised - and in theory, this mixture is uniform in its distribution. So called ‘homogeneous’, the amount of fuel in proportion to air should be chemically correct. What this means is that there is enough air, containing oxygen, to fully oxidise or ‘burn’ all of the fuels volatile content. Sounds quite straight forward, but in practice, not that easy considering all the operating conditions that a vehicle engine has to encounter. This mixture is compressed in the cylinder as the cylinder volume decreases due to the piston rising towards top dead centre (TDC), the pressure increases, with reference to simple gas laws, the temperature of this mixture also increases, but not sufficiently to reach the ignition point of the fuel/air mixture.

So far then we have mixed fuel and air and compressed it. But there are many hurdles for the engine designer to overcome to be able to do this efficiently for a multi-cylinder engine. These days, fuel is injected into the air stream, near the inlet port, but remember the carburettor (or even a single point injector). The mixture preparation occurs away from the point of entry into the cylinder, thus, distributing the mixture evenly to each cylinder, with the same amount of fuel for each cylinder, for a given operating condition, was a real headache for the engine designer.


Fig 1 - Single a) and Multi-point b) injection system layout 

Why? - well, in order to get the best possible performance and efficiency out of an engine, the individual cylinder contributions must be as even as possible, with as little variation as possible. Even small variations have a dramatic effect on the overall engine performance, so even mixture distribution is key to this, and impossible to achieve fully with a centralised mixture preparation system like a single carburettor shared between cylinders.. In addition, the distance that the mixture travels in order to get to the cylinder has another effect, that is the possibility that the fuel and air may separate during transit - the fuel literally drops out of the moving air becoming liquid droplets again (instead of a finely atomised spray). This is known as wall wetting, and causes flat spots due to instantaneous weak mixtures being introduced to the cylinder, this effect is much worse at low temperature (hence the need for the choke in days gone by, to enrich the mixture when cold) and during transient operation, where the air accelerates faster than the fuel (hence the need for an accelerator pump, to richen the mixture during accelerations). These were some of the arguments for the move to port fuel injection to each cylinder, thus contributing to improving efficiency and reducing emissions.

Back to combustion - fuel and air is mixed and compressed, now we are ready to produce some work. In a gasoline engine, I am  sure we all know that an electrical spark or arc is used to start combustion. We mentioned before that the mixture temperature is raised, but not beyond its ignition point. The intense electrical arc produced by the spark plug at it’s electrodes creates a localised heating of the mixture, sufficient for the fuel elements to begin oxidising and combustion of the mixture starts with a concentric flame front growing outwards from the initial ignition kernel. Once this process is initiated, it perpetuates itself, there is more or less no control over it. We just have to hope that the mixture is prepared correctly to sustain this flame so that is consumes all of the mixture, burning it cleanly and completely. The technical term for this type of combustion is ‘pre-mixed’. The engine is ‘throttled’ to control the mass of mixture in the cylinder, and hence its power output. The throttle being a characteristic of the gasoline engine.

Fig 2 - Flame propagation in a gasoline engine via optical imaging system (source: AVL)

An important point to note is that the speed that this flame travels across the combustion chamber is important, the typical  flame speed, travelling through an air/fuel mixture, would be far too slow in a combustion engine (approximately 0.5 metres per second). So, we have to speed things up. The way this is done is via cylinder charge motion, or turbulence. The turbulence is generated via induction and compression processes in conjunction with the combustion chamber design and has the effect a breaking up the flame front, increasing its surface area, thus increasing the surface area of fuel mixture for oxidation. Assuming a normal combustion event, the flame front grows out to the periphery of the cylinder where it decays once all the mixture is burned.


Fig 3 - Charge motion speeds up the combustion process, in a gasoline engine this is generally known as 'tumble'

Of course the timing of this event is essential! Ideally, we want the cylinder pressure, forcing down on the piston, to occur at the correct time relative to the crank angle. Seems obvious - too soon and we may be trying to push against the rising piston, too late and the piston is already moving down the bore, hence the expansion of the gas won’t do any work and the energy will be wasted as excessive heat in the exhaust.. A simple analogy would be to imagine pushing someone on a swing - too soon and the effect is collision, too late and the effect is no force transmitted - well, it’s the same in the engine cylinder. What engine engineers do know, is that half of the total fuel energy should be released at around 8 to 10 degrees after top dead centre. This can be measured by cylinder pressure analysis during an engine test. Hence, with a new engine design, the appropriate ignition timing can be mapped via monitoring the cylinder pressure for energy release, as well as knock, in order to map the correct value for a given engine operating condition. In summary then, the key points to consider regarding the spark ignition engine:
  • The fuel/air mixture is prepared externally, and ignited via a timed spark
  • The engine power is controlled via throttling, which reduces efficiency, particularly at part-load
  • The compression ratio is limited by self-ignition of the fuel/air mixture
  • In operation, engine maximum torque is limited by abnormal combustion (knocking)
  • Cylinder to cylinder variation (due to fuel distribution problems, and other factors) reduces the efficiency of the engine and is significant in a spark ignition engine

Thursday, 25 July 2013

Technology focus - Future developments in On-Board Diagnostics

The latest generation of OBD is a very sophisticated and capable system for detecting emission related problems with the engine and powertrain. But, it relies on the fact that it is necessary to get the driver of the vehicle to do something about any problem that occurs. 

With respect to this factor, OBD2/EOBD is no improvement over OBD1 - as there must be some enforcement capability. Currently under consideration are plans for OBD3, which would take OBD2 a step further by adding the possibility of remote data transfer. This would involve using remote transmitter/transponder technology similar to that which is already being used for automatic electronic toll collection systems. An OBD3 equipped vehicle would be able to report emissions problems directly back to a regulatory agency. The transmitter/transponder would communicate the vehicle VIN (Vehicle Identification Number) and any diagnostic codes that have been logged. The system could be set up to automatically report an emissions problem the instant the MIL light comes on, or alternatively, the system could respond to answer a query from a regulator to its current emissions performance status.

What makes this approach so attractive is its efficiency, with remote monitoring via the onboard telemetry, the need for periodic inspections could be eliminated because only those vehicles that reported problems would have to be tested. The regulatory authorities could focus their efforts on vehicles and owners who are actually causing a violation rather than just random testing. It is clear that with a system like this, much more efficient use of available regulatory enforcement resources could be implemented, with a consequential improvement in the quality of our air.

An inevitable change that could come with OBD3 would be even closer scrutiny of vehicle emissions. The misfire detection algorithms currently required by OBD2 only watches for misfires during driving conditions that occur during the prescribed driving cycles. It does not monitor misfires during other engine operating modes like full load for example. More sophisticated methods of misfire detection will become common place which can feedback other information to the ECU about the combustion process, for example, the maximum cylinder pressure, detonation events or cylinder work done/balancing. This adds another dimension to the engine control system allowing greater efficiency and more power from any given engine design just via more sophisticated ECU control strategy.

Future OBD system will undoubtedly incorporate new developments in sensor technology. Currently the evaluation is done via sensors monitoring emissions indirectly. Clearly an improvement would be the ability to measure exhaust gas composition directly via on-board measurement systems (OBM). This is more in keeping with emission regulation philosophy and would overcome the inherent weakness of current OBD systems, that is, they fail to detect a number of minor faults that do not individually activate the MIL, or cause excessive emissions but whose combined effect is to cause the production of excess emissions.

The main barrier is the lack of availability of suitably durable and sensitive sensors for CO, NOx and HC. Some progress has been made with respect to this and some vehicles are now being fitted with NOx sensors. Currently there does appear to be void between the laboratory based sensors used in research and reliable mass produced units that could form the basis of an OBM (On Board Monitoring) system.


Fig 1 - NOx sensors are now in use! (Source: NGK)

Another development for future consideration is the further implementation of OBD for diesel engines. As diesel engine technology becomes more sophisticated, so does the requirement for OBD. In addition, emission legislation is driving more sophisticated requirements for after treatment of exhaust gas. All of these subsystems are to be subjected to checking via the OBD system and present their own specific challenges. For example, the monitoring of exhaust after treatment systems (particulate filters and catalysts) in addition to more complex EGR and air management systems.


Fig 2 - Current monitoring requirements for diesel engines

Rate based monitoring will be more significant for future systems which allows in-use performance ratio information to be logged. It is a standardised method of measuring monitoring frequency and filters out the affect of short trips, infrequent journeys etc. as factors which could affect the OBD logging and reactions. It is an essential part of the evaluation where driving habits or patterns are not known and it ensures that monitors run efficiently in use and detect faults in a timely and appropriate manner. It is defined as…

Minimum frequency = N/D

Where:
N = Number of times a monitor has run
D = Number of times vehicle has been operated

A significant factor in the development of future system will be the implementation of the latest technologies with respect to hardware and software development. Model based development and calibration of system will dramatically reduce the testing time by reducing the number of test iterations required. This technique is quite common for developing engine specific calibrations for ECUs during the engine development phase.

Virtual Development of OBD
Hardware-in-loop (HIL) simulation plays a significant part in rapid development of any ECU hardware and embedded system. New hardware can be tested and validated under a number of simulated conditions and its performance verified before it even goes near any prototype vehicle. The following tasks can be performed with this technology:

Full automation of testing for OBD functionality
Testing parameter extremes
Testing of experimental designs
Regression testing of new designs of software and hardware
Automatic documentation of results


Fig 3 - HiL environment for OBD testing

However, even in a HiL environment, an expensive target platform is needed (i.e. a development ECU). These are normally expensive, and in a typical development environment, they are scarce. In line with the general Industry trend to 'frontload' - it is now possible to have a complete virtual ECU and environment for testing of ECU functions, including OBD, running on a normal PC with a real time environment. The advantage is that no hardware is needed, but more importantly, simulation procedures (drive or test cycles) can be executed faster than real time - this means a 20 minute real time test cycle, can be executed in a few seconds - this has a significant benefit in the rapid prototype phase. See more information about virtual ECU development here:

Wednesday, 26 June 2013

F1 Engineering and Development - Replication or Simulation?

Many race teams spend massive amounts of their budget on test systems and instrumentation at all phases of the powertrain development process. In F1 this is particularly pertinent due to the limited amount of track time available for testing. However, this investment does not always guarantee success, many large teams, with the most sophisticated facilities have struggled, and many teams have done very well, with limited facilities. At the end of the day, it is all about the team!

However, one thing that comes up many times is the question – How to get closer to reality? But is it really necessary, especially when balanced against the cost of achieving it! Many teams have or are moving to transient or dynamic powertrain test systems. With the associated control systems, these have the advantage of being able operate and load the powertrain, during testing, in a way that is much closer to real operating conditions when compared to a steady state test. This is particularly useful for establishing the engine response and performance during transients (where, in most cases, the engine spends most of its life). In addition, durability tests are much more accurate for predicating and validating engine and component life.

F1 PURE Toyota Motorsport
Fig 1 - An F1 Engine test facility (Toyota Motorsport, Cologne)

In many test system, there are two main ways to try to replicate ‘real life’, assuming that you have a control system with a fast enough controller, and a 4-quadrant dynamometer with fast enough torque build up time, and a good inertia match to the unit under test. You can achieve very fast transient response, generally good enough to be able to follow a speed/throttle profile generated from telemetry or track simulation data. This is often known as replication – and is a useful test mode as it is relatively simple to get up and running, due to the fact that sophisticated simulation models are not generally needed. It is useful for validation of the engines load response, also for checking transient calibration/mapping and for endurance testing based on defined operation conditions. The compromise is that high dynamic components are not generally simulated. These components can have a significant effect on the powertrain during operation. In particular, component durability is more difficult to establish as the test systems does not have the same Eigen frequencies as a powertrain mounted in the vehicle, with the associated ancillary components.

F1 Renault engine V8
Fig 2 - Renault sport current engine (RS27) for F1

The next step closer to reality is to be able to ‘simulate’ as many of the high dynamic frequencies relating to the powertrain as possible. To do this, the dynamometer must have very low inertia in combination with a very fast, real-time controller in order to be able to simulate true ‘zero’ inertia when required, particularly important for simulation of gearshifts, and torque steps during ignition cuts.

In addition to this hardware, a sophisticated software simulation environment must exist to provide the demand values to the dynamometer controller, at a sufficiently high frequency to be able to generate the oscillation frequencies of the powertrain in each gear. In addition, this environment must allow characterisation and parameterisation of the vehicle dynamics, aerodynamics and driver response/behaviour. The more sophisticated the environment, the more parameters need characterising and setting. This can then take days to set the test system up for a test run. So, in practice, many teams tend to use the same test environment setting for every given test mode. There simply isn’t time to reprogram the test system with every engine change!

Heat Motor Generator Unit
Fig 3 - Renault sport HMGU (Heat Motor Generator Unit), for use in next years F1 power unit concept (engines are now power units according to Renault)

What direction for the future then – simulation environments are very effective at accelerating development processes, and are essential in todays world of the increasing complex variables to be optimised in any system – engine, transmission, powertrain, aerodynamics. But we’ll always need to test in order to validate any simulation and the closer the test environment to reality, the better the data, in order to validate simulations, and optimise the system!

Fig 4 - A typical test bed arrangement for High-performance engine testing - allows testing of engine only (with test system gearbox in place, as shown) or, powertrain (move test system gearbox out, use vehicle transmission)

Saturday, 22 June 2013

Technology focus - Diesel Common Rail - Pressure Wave compensation

A common rail diesel fuel system is an impressive bit of mass produced Engineering! The rail and injectors operate a extremely high pressures, in an under bonnet environment, and generally speaking, are quite durable and long lasting. The components in the fuel path are capable of metering accurately, fuel quantities from down to a few milligrams per stroke, up to the required amount for full load - approximately an order of magnitude difference. 

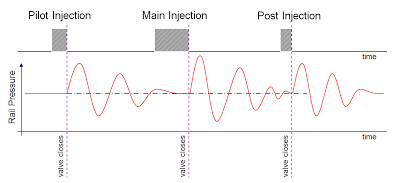
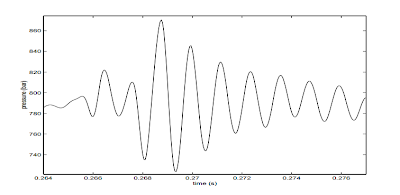
Clever stuff - but one thing to be considered in this system is the basic physics in fluid dynamics! In order to deliver the correct quantity of fuel, the injector opening time and pressure are used as basic parameters - i.e. increase the pressure and/or opening time and you'll get more fuel delivered into the cylinder! However, when the injector opens/closes, a pressure wave is generated which reflects back within the common rail, and then bounces back to the injector. This has the effect of altering the actual pressure at the injector momentarily. So, where multiple injection events occur - this can mean, at the precise moment the injector opens, the pressure could be higher or lower than required. Not good - this invalidates the calculation done by the ECU for the required fuel as it cannot be accurately delivered to the engine - this can affect badly affect emissions, fuel consumption and drivability at certain engine operating conditions.


Fig 1 - Pressure waves from one injection event can affect a subsequent event with respect to the amount of fuel delivered


The pressure wave effect is well established in engine technology - for example, it is used in variable length, tuned intake runners/manifolds, in order to provide a pressure wave supercharging effects. It is also the basic principle used in an expansion chamber, as seen on performance 2 stroke engines - in this case, the exhaust pressures waves are used to help scavenge the cylinder and assist the gas exchange process. The effect itself is very dependant on a number of environmental conditions, mainly, pressure, temperature and volume, also frequency and amplitude of the excitation event (hence the shape of an expansion chamber which has a tuned volume to coincide the effect at the optimum engine speed for maximum power).

Fig 2 - Actual pressure at the injector due to pressure wave effects

The solution to this common rail problem is to 'calibrate' it out. There is a function in the ECU which can provide a compensation for the effect. This function takes into account the main parameters which characterise the effect - namely injection quantities of each event, the separation distance between events and the actual rail pressure. There are calibration maps than need populating with data derived from a specific test process, this allows the effect to be measured.

Fig 3 - calibration maps for pressure wave compensation

The procedure involves running the engine in a very stable speed/load condition whilst measuring fuel consumption with high accuracy, whilst varying the separation time between injector events. After measurement and modelling, a simple 2D curve showing the effect very clearly, can be observed

Fig 4 - Effect of pressure waves on actual fuel consumed, as a function of injector separation time


This data can then be used in further analysis to populate the calibration maps in the correction function. That allows the ECU and Fuel injection system to always be able to provide the correct fuel quantity with respect to operating condition and environment. Note that during this procedure, a set of highly accurate, calibrated injectors is used (not a standard set which are produced to normal production tolerances, they would not be accurate enough).

Monday, 10 June 2013

Vehicle Battery Testing – for accurate diagnostics

Modern vehicles have sophisticated energy requirements, and very sophisticated electronic consumers that need a stable, clean voltage supply. Already workshops are seeing obscure faults with electronic systems, including fault code errors, brought on by failing batteries. 

Traditionally, a failing battery would manifest itself by having insufficient power to crank the engine over and start the vehicle. Often more apparent in the winter months, when cold starts need more torque to overcome the friction of a cold engine, with thicker, cold lubricating oil. However, with modern vehicles, a failing battery is likely to produce a fault, of an unrelated nature, before this ‘non start’ symptom occurs. Battery technology has also progressed in line with the vehicle systems, and a different method of establishing the serviceability is now available, and more appropriate. Let’s take a look at this new generation testing technology, and how you can use it to provide better customer service through more accurate diagnosis.

Traditional test methods
There are 2 traditional methods of checking a wet, lead-acid, vehicle battery. The first is State of charge (SOC) which can be determined via measuring the specific gravity (SG) of the electrolyte in each cell with a hydrometer (but there is also a less accurate option, to measure the battery terminal voltage). Assuming the battery is reasonably well charged (>75%), then the performance test, indicating state-of-health (SOH), can be executed via a discharge test. This test is performed using a high rate discharge tester, with the appropriate load according to the battery capacity, and it would indicate the battery capability to supply a large current (as would be required under starting conditions). From these measurements, an experienced technician could make a judgement on the battery fitness for purpose.

 
Fig 1 - A high-rate discharge tester can indicate battery state-of-health, but still relies on the skill and judgement on the technician, in addition, there are several health and safety related issues to this approach! Note the tester in the picture is a fixed load, and not really suitable for the battery shown

Why are these test methods no longer applicable?
There are several reasons that these methods cannot really be applied:

  • Many modern battery types (VRLA, AGM, Gel) have no access to the cell electrolyte, thus hydrometer readings are simply not possible, although the battery may have a built in hydrometer, this is of limited use, it’s just an indicator. 
  • In order to execute a high-rate discharge test, the battery has to be disconnected from the vehicle – this can present time consuming problems for the technician e.g. lost radio codes, ECU memory loss etc.
  • There are health and safety issues, wet batteries contain acid, and generate volatile gases. High rate loads tests can create sparks and heat. All potential nightmares in a safety conscious, workshop environment. 
  • The measurements still rely on the knowledge and experience of the technician to make a judgement on the battery SOH. This is subjective and could be the source of inaccurate diagnoses.
The alternative – digital battery testers - conductance testing
Along with the progress in battery and vehicle technology, technology developments have also provided alternative methods in battery testing. Mainly in the form of battery testers that use a completely different approach to evaluating the battery condition, providing an objective measurement of battery condition and capability, along with a more accurate SOH assessment. These testers are intelligent units, with built in, menu guided test procedures. However, the biggest impact is due to the measurement technique itself – a conductance measurement.


Fig 2 –  Intelligent, digital battery testers are much safer, and more appropriate for testing modern battery technology

How does this work
The conductance test is a completely different method of establishing the battery condition and performance, and is ideally suited for modern vehicle battery test applications. It can also though be applied to older, wet lead-acid batteries as well. So, how does it work? The conductance tester applies an AC voltage, of known frequency and amplitude across the battery terminals, and monitors the subsequent current that flows with respect to phase shift and ripple.  The AC voltage is superimposed on the battery's DC voltage and acts as brief charge and discharge pulses. This information is utilized to calculate the impedance (measure of opposition to alternating current) of the battery, and from this the conductance value can established (impedance and conductance have a reciprocal relationship).


Fig 3 – AC voltage across the DC battery allows a measurement of the batteries conducting capability to be made

A conductance measurement provides a measure of the plate surface area, and this determines how much chemical reaction or power the battery can generate. It has been proven by experiment that a conductance value has direct correlation with the batteries capability to provide a current, which is normally specified via a Cold Crank Amps rating (CCA), but it is also a good indicator of battery state of health (SOH). Taking into account temperature and other parameters like age, chemistry etc. this test can accurately form the basis of an objective condition evaluation, and can be used as a reliable predictor of battery end-of-life.


Fig 4 – Conductance and Battery Capacity (with respect to the ability to supply large current) have a direct relationship


In order to provide a better understanding of the concept of the information provided by a conductance test, take a look at the comparison with a fuel tank. A healthy battery, when fully charged, can be compared directly to a full tank (i.e. full capacity). When discharged, it’s the same as an empty or low fuel tank (i.e. low capacity). However, when the battery has aged and SOH has declined, the reduced active plate surface area causes an effective reduction in the current supplying capability.


Fig 5 – Battery SOC and SOH, for illustration, compared to a fuel tank


Comparing with the fuel tank, this would be comparable to damage to the fuel tank, which has reduced its volume (for example, a large dent in the tank). So, even if you fill the tank, and the gauge shows full, the actual capacity of the fuel tank is reduced.

Summary
The conductance tester is an accurate, repeatable method. The tester can be applied to a connected battery in the vehicle. The test method is much safer for the operator and the vehicle. The result from the test is much more objective and factual. The tester can be applied to many modern battery technologies, and this is particularly important as battery technology is currently changing and adapting to new demands and load profiles generated by the latest technologies to reduce vehicle tailpipe emissions, namely stop/start and energy recovery technologies. This is an addition to smart energy management and battery charging systems, already seen in service on many current vehicles.


Monday, 3 June 2013

Automotive Diagnostics - an overview

The diagnostic skill of a technician in the Automotive Industry is one of the key attributes which sets aside the top-performing, most valuable members of technical staff from the rest. Skilled diagnostic technicians are a valuable asset in the Industry and most people who can demonstrate this ability are high-achieving Master Technicians who have the most interesting and challenging careers. 

Diagnostics skills are a combination of applied knowledge and experience, logical thought process, in combination with an inquisitive nature. That is, the instinct of a technical mind to understand how something works. A logical approach to fault finding is essential to avoid wasting time and money. If a fault occurs on a vehicle which is a known problem or you have come across before. Then, using your experience, you can optimise your time spent rectifying this fault as you have some direction. The diagnostic skill becomes apparent when you are looking at a problem you haven’t seen before. In this situation, many Technicians resort to changing component parts blindly, this is not acceptable for modern vehicles as these parts can be very expensive. A starting point is to use some method or philosophy to approach the problem. A simple but logical, generic process (as shown below) puts a structure behind your actions.


Fig 1 - Successive Approximation - a logical fault-finding process!

Successive approximation method
This method allows you to successively, physically check parts of a wiring circuit, in a logical way such that with each check, you will definitely get closer to the fault. This reduces the amount of time spent tracing faults electrical faults in the vehicle wiring system. If the circuit layout is not known, or is complex, then a wiring diagram will help considerably. The principle involves finding the ‘middle’ of the offending circuit path. Form this point you can check which side of the circuit has failed with the appropriate test tool. Once you identified this, you have immediately reduced the size of the problem by half! Next, you identify the half way point of the bad part of the circuit (above), then, make another check at this point. This technique rapidly reduces the size of the problem with each step. Finally, you will reach a point where the problem is easy to identify as you can locate a very specific area (for example, a junction block) where the problem has to exist. This technique is very powerful and can be applied to any circuit.

Dealing with Open circuits
Open circuits are identified normally by a loss of power. This can be easily checked with a voltmeter or test-lamp via an open-circuit test. Generally the voltmeter has the advantage that it does not damage any sensitive components but it cannot identify a high resistance in an unloaded circuit. That is, the voltmeter tells you that a connection exists which can supply the voltage, not how good that connection is! An ohmmeter can also to used to check for open circuits but the circuit or component must be completely un-powered. Also, low resistances cannot be tested effectively with a ohmmeter.

Dealing with Short Circuits
Short circuits are where a direct path to ground exists, In an electrical circuit the current will always take the easiest path, if this happens the circuit is overloaded and (hopefully) a fuse (or other protection device )will operate and protect the circuit. Short circuit detectors are available that switch the fault current on and off in the circuit (they are fitted in place of the blown fuse). It is then  possible to identify the position of the fault using a compass or inductive ammeter. This means that it is possible to locate the fault without removing trim. The problem is that a high current still flows momentarily and thus, if the wire in the faulty circuit is a small size, it can still overheat. A better solution is to use a high-wattage bulb (>21w), this will not overload the circuit but the intensity of the lamp allows you to distinguish a dead short from the normal circuit current. This method is particularly useful for tracing intermittent faults. Examining the fuse can give information about the nature of the fault. If the fuse has ‘blown’ then a dead short exists. If it has overheated then an overload has occurred (a faulty component?). If it has just fractured then the fuse itself could have fatigued and failed with no specific circuit fault.

Dealing with Parasitic Loads
Parasitic loads are current drawn whilst the vehicle is standing inoperative. Most vehicles have a small, standing current draw due to electronic components (~50mA) but more than this will flatten the battery over an extended period of say, a few days. In order to isolate a load of this kind an ammeter must be connected in circuit with the battery. By removing the fuses one-by-one of all the components which draw a quiescent current (quiescent = being in a state of repose; at rest; still; not moving) can be identified and eliminated, as once the offending circuit component fuse is disconnected, the drop in current draw will be seen at the ammeter. It is then possible to follow this current draw via the wiring system by disconnecting at appropriate wiring junctions, in this way the circuit component can be isolated.

Voltage Drop Testing
Volt drop testing is a dynamic test of the circuit under operating conditions and is a very reliable way of determining the integrity of the circuit and its components. With this technique, problem resistances in circuits which carry a significant current ( >3amps) can be clearly identified. For these circuits, even a resistance of 1 ohm can cause a problem (remember that V =IR, therefore a resistance of 1 ohm in a circuit carrying 3 amps will drop 3 volts across the resistance, that is 25% of the available voltage for a 12 volt system). Because the test is done whilst the circuit is operating, factors such as current flow and heating effect will be apparent. To test for volt drop, the voltmeter is placed in parallel  with the circuit section to be tested. During operation of the circuit, any unwanted resistance will show as a voltage reading. In general, not more than 10% of the system voltage should be dropped between the source (the battery) and the consumer (the load). Voltage drop measurements should be carried out on return (earth) as well as the supply side of the circuit and generally voltage dropped on the earth side should be lower.

On board diagnostics
Remember that many chassis and body system components now use the same communication methods and techniques to share information as Powertrain systems (e.g. CAN, LIN) and operate on the same network. Body and Chassis Diagnostic Trouble Codes (DTC’s) are defined in the OBD protocol standard and hence there is much useful information to be gained when troubleshooting by exploiting the OBD functionality. Generally, Powertrain codes start with a P, Body and Chassis codes start with a B and C respectively. For more sophisticated control systems, accessing the DTC’s should be the first step in a diagnostic procedure. In many systems, this will be the only way to start fault finding as the system and it’s components are so complex.

An example of some generic chassis codes is shown below:

C0000 - Vehicle Speed Information Circuit Malfunction
C0035 - Left Front Wheel Speed Circuit Malfunction
C0040 - Right Front Wheel Speed Circuit Malfunction
C0041 - Right Front Wheel Speed Sensor Circuit Range/Performance (EBCM)
C0045 - Left Rear Wheel Speed Circuit Malfunction
C0046 - Left Rear Wheel Speed Sensor Circuit Range/Performance (EBCM)
C0050 - Right Rear Wheel Speed Circuit Malfunction
C0051 - LF Wheel Speed Sensor Circuit Range/Performance (EBCM)
C0060 - Left Front ABS Solenoid #1 Circuit Malfunction
C0065 - Left Front ABS Solenoid #2 Circuit Malfunction
C0070 - Right Front ABS Solenoid #1 Circuit Malfunction
C0075 - Right Front ABS Solenoid #2 Circuit Malfunction
C0080 - Left Rear ABS Solenoid #1 Circuit Malfunction
C0085 - Left Rear ABS Solenoid #2 Circuit Malfunction
C0090 - Right Rear ABS Solenoid #1 Circuit Malfunction
C0095 - Right Rear ABS Solenoid #2 Circuit Malfunction
C0110 - Pump Motor Circuit Malfunction
C0121 - Valve Relay Circuit Malfunction
C0128 - Low Brake Fluid Circuit Low
C0141 - Left TCS Solenoid #1 Circuit Malfunction
C0146 - Left TCS Solenoid #2 Circuit Malfunction
C0151 - Right TCS Solenoid #1 Circuit Malfunction
C0156 - Right TCS Solenoid #2 Circuit Malfunction
C0161 - ABS/TCS Brake Switch Circuit Malfunction
C0221 - Right Front Wheel Speed Sensor Circuit Open
C0222 - Right Front Wheel Speed Signal Missing
C0223 - Right Front Wheel Speed Signal Erratic
C0225 - Left Front Wheel Speed Sensor Circuit Open
C0226 - Left Front Wheel Speed Signal Missing
C0227 - Left Front Wheel Speed Signal Erratic

An example of some generic Body codes is shown below:

B1200 Climate Control Pushbutton Circuit Failure 
B1201 Fuel Sender Circuit Failure 
B1202 Fuel Sender Circuit Open 
B1203 Fuel Sender Circuit Short To Battery 
B1204 Fuel Sender Circuit Short To Ground 
B1213 Anti-Theft Number of Programmed Keys Is Below Minimum 
B1216 Emergency & Road Side Assistance Switch Circuit Short to Ground 
B1217 Horn Relay Coil Circuit Failure 
B1218 Horn Relay Coil Circuit Short to Vbatt 
B1219 Fuel Tank Pressure Sensor Circuit Failure 
B1220 Fuel Tank Pressure Sensor Circuit Open 
B1222 Fuel Temperature Sensor #1 Circuit Failure 
B1223 Fuel Temperature Sensor #1 Circuit Open 
B1224 Fuel Temperature Sensor #1 Circuit Short to Battery 
B1225 Fuel Temperature Sensor #1 Circuit Short to Ground 
B1226 Fuel Temperature Sensor #2 Circuit Failure 
B1227 Fuel Temperature Sensor #2 Circuit Open 
B1228 Fuel Temperature Sensor #2 Circuit Short to Battery 
B1229 Fuel Temperature Sensor #2 Circuit Short to Ground 
B1231 Longitudinal Acceleration Threshold Exceeded


Key points and summary:
Try to employ a logical approach to your fault finding, this prevents wasting time and replacement of unnecessary components.
  • Try to familiarise yourself with the system and attempt to understand how the system works (assuming the information is available) this allows you to use your time more efficiently and effectively.
  • Use a heuristic approach, use your experience with similar problems or scenarios to optimise the use of your time dealing with the current problem in hand.
  • Always take the path of least resistance, test or check the components that are easiest to access first to prevent wasted time removing trim unnecessarily.
  • Never overlook the obvious, never assume anything, always check things out for yourself. Assume everybody else is an idiot and make your own checks to ensure that you always have the correct information during your investigation process.
  • Always gather as much information as you can. If available, use manuals and wiring diagrams, check them even if you think you know how the system works! If DTC’s are available and accessible, use them to help point you in the right direction to start dealing with the problem
  • When dealing with intermittent problems take a strategic approach, even though the systems can be complex there is no magic. If something doesn't work there is a reason, also problems don’t fix themselves, try to get to the root of the problem, if you don’t it will come back!